

To many workers in the United States, it seems like the federal minimum wage has yet to catch up with the rising cost of living. A large number of people are still making more or less the same amount of money they made 10 or 20 years ago even though inflation is high and resources are scarce.
This is not so in some other countries. Some nations have seen their minimum wage increase by astonishing proportions in a short span of time, but the rise doesn’t always reflect the surge in living costs in those places, either! These are hard times globally.
Picodi.com, an eCommerce website, has compiled the latest available statistics on minimum wages worldwide. It has aggregated the data into the infographic below, using net values in local currencies (money that actually made it into the pockets of the workers) and converting them to U.S. dollars.
While it might look like workers in some countries are doing great compared to others, the annual expenses of someone in Australia may differ significantly from those of someone in Uzbekistan. Where does your country fall on the spectrum?
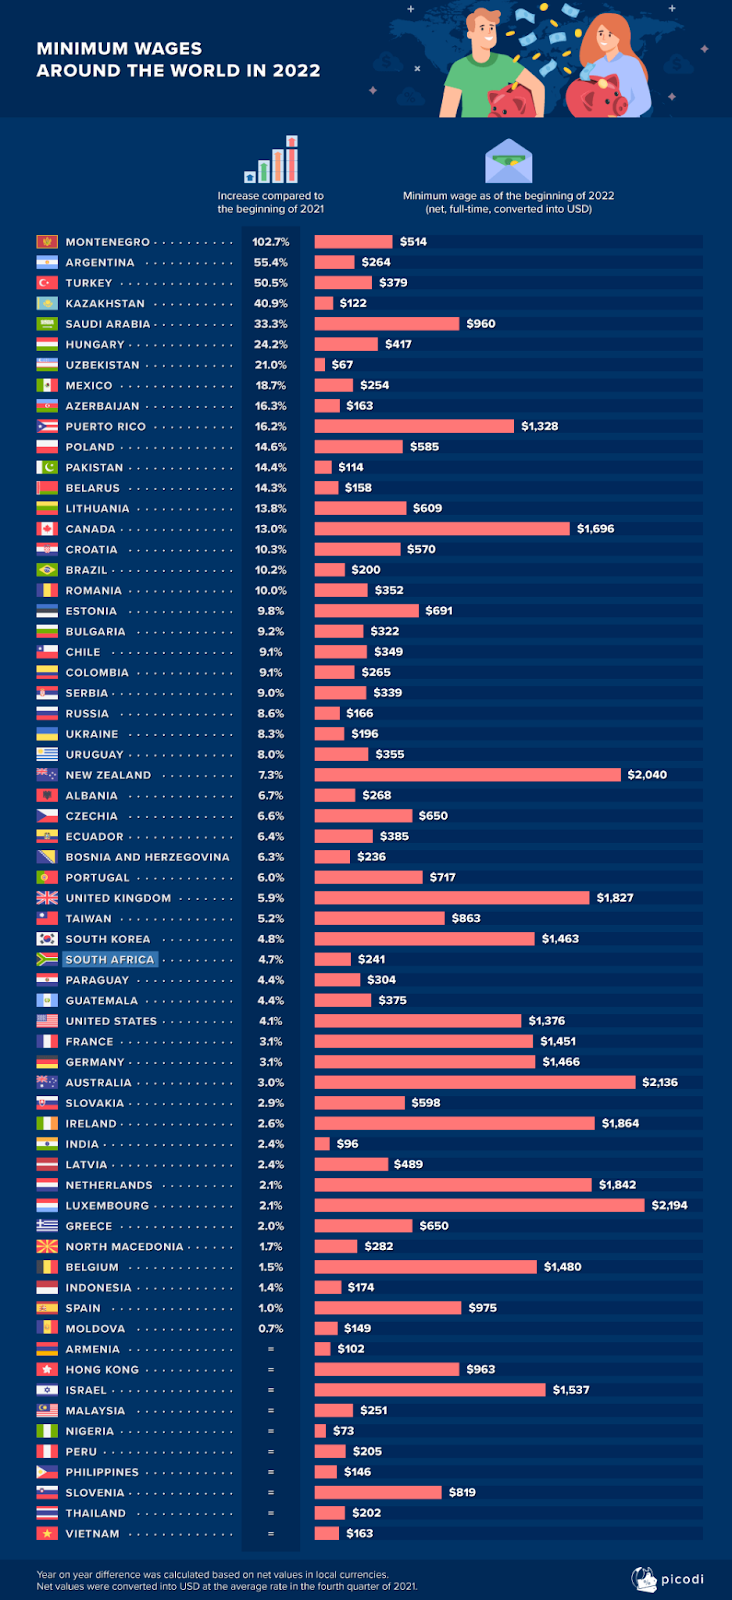
| Country | Increase compared to the beginning of 2021 | Min. wage as of the beginning of 2022 (net, full-time, converted into USD) |
| Montenegro | 102.7% | $514 |
| Argentina | 55.4% | $264 |
| Turkey | 50.5% | $379 |
| Kazakhstan | 40.9% | $122 |
| Saudi Arabia | 33.3% | $960 |
| Hungary | 24.2% | $417 |
| Uzbekistan | 21.0% | $67 |
| Mexico | 18.7% | $254 |
| Azerbaijan | 16.3% | $163 |
| Puerto Rico | 16.2% | $1,328 |
| Poland | 14.6% | $585 |
| Pakistan | 14.4% | $114 |
| Belarus | 14.3% | $158 |
| Lithuania | 13.8% | $609 |
| Canada | 13.0% | $1,696 |
| Croatia | 10.3 | $570 |
| Brazil | 10.2% | $200 |
| Romania | 10.0% | $352 |
| Estonia | 9.8% | $691 |
| Bulgaria | 9.2% | $322 |
| Chile | 9.1% | $349 |
| Colombia | 9.1% | $265 |
| Serbia | 9.0% | $339 |
| Russia | 8.6% | $166 |
| Ukraine | 8.3% | $196 |
| Uruguay | 8.0% | $355 |
| New Zealand | 7.3% | $2,040 |
| Albania | 6.7% | $268 |
| Czechia | 6.6% | $650 |
| Ecuador | 6.4% | $385 |
| Bosnia and Herzegovina | 6.3% | $236 |
| Portugal | 6.0% | $717 |
| United Kingdom | 5.9 | $1,827 |
| Taiwan | 5.2% | $863 |
| South Korea | 4.8% | $1,463 |
| South Africa | 4.7% | $241 |
| Paraguay | 4.4% | $304 |
| Guatemala | 4.4% | $375 |
| United States | 4.1% | $1,376 |
| France | 3.1% | $1,451 |
| Germany | 3.1% | $1,466 |
| Australia | 3.0% | $2,136 |
| Slovakia | 2.9% | $598 |
| Ireland | 2.6% | $1,864 |
| India | 2.4% | $96 |
| Latvia | 2.4% | $489 |
| Netherlands | 2.1% | $1,842 |
| Luxembourg | 2.1% | $2,194 |
| Greece | 2.0% | $650 |
| North Macedonia | 1.7% | $282 |
| Belgium | 1.5% | $1,480 |
| Indonesia | 1.4% | $174 |
| Spain | 1.0% | $975 |
| Moldova | 0.7% | $149 |
| Armenia | = | $102 |
| Hong Kong | = | $963 |
| Israel | = | $1,537 |
| Malaysia | = | $251 |
| Nigeria | = | $73 |
| Peru | = | $205 |
| Philippines | = | $146 |
| Slovenia | = | $819 |
| Thailand | = | $202 |
| Vietnam | = | $163 |
Just updated: 50+ Ways to Make Money (including 30+ work from home jobs)
More ways to make money:
FlexJobs – Find remote and flexible jobs in over 50 career fields from all over the world.
Swagbucks – Earn free gifts and cash-back rebates by searching the web, playing games, watching videos, shopping, and more.
Writers Work – Find freelance writing jobs and publish your articles, all while working from home.
Public.com – Get free stock just for signing up for this investment app.